

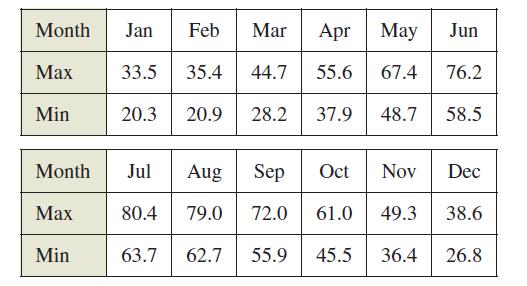
Question: The table shows the normal maximum (high) and minimum (low) temperatures (in degrees Fahrenheit) in Erie, Pennsylvania, for each month of the year. The maximum
The table shows the normal maximum (high) and minimum (low) temperatures (in degrees Fahrenheit) in Erie, Pennsylvania, for each month of the year.
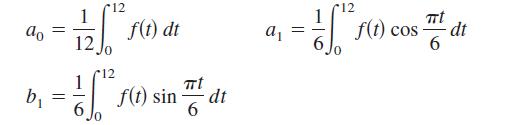
The maximum and minimum temperatures can be modeled by
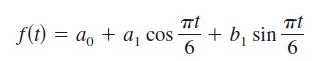
where t = 0 corresponds to January 1 and a0, a₁, and b₁ are as
follows.
(a) Approximate the model H(t) for the maximum temperatures.
(b) Repeat part (a) for a model L(t) for the minimum temperature data.
(c) Use a graphing utility to graph each model. During what
part of the year is the difference between the maximum
and minimum temperatures greatest?
Month Jan Feb Max Min Max Mar Apr May Month Jul Aug 80.4 79.0 63.7 62.7 55.9 Min 33.5 35.4 44.7 55.6 20.3 20.9 28.2 37.9 Sep 72.0 Oct Jun 67.4 76.2 48.7 58.5 Nov Dec 61.0 49.3 38.6 45.5 36.4 26.8
Step by Step Solution
3.42 Rating (161 Votes )
There are 3 Steps involved in it
a b c ft a cos ao ... View full answer

Get step-by-step solutions from verified subject matter experts