

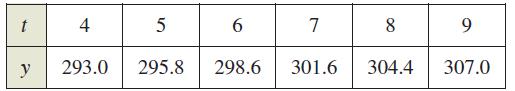
The table shows the populations y (in millions) of the United States for 2004 through 2009. The
Question:
The table shows the populations y (in millions) of the United States for 2004 through 2009. The variable t represents the time in years, with t = 4 corresponding to 2004.
(a) Plot the data by hand and connect adjacent points with a line segment.
(b) Use the slope of each line segment to determine the year when the population increased least rapidly.
(c) Find the average rate of change of the population of the United States from 2004 through 2009.
(d) Use the average rate of change of the population to predict the population of the United States in 2020.
Fantastic news! We've Found the answer you've been seeking!
Step by Step Answer:
a b c d Population in m...View the full answer

Answered By
Utsab mitra
I have the expertise to deliver these subjects to college and higher-level students. The services would involve only solving assignments, homework help, and others.
I have experience in delivering these subjects for the last 6 years on a freelancing basis in different companies around the globe. I am CMA certified and CGMA UK. I have professional experience of 18 years in the industry involved in the manufacturing company and IT implementation experience of over 12 years.
I have delivered this help to students effortlessly, which is essential to give the students a good grade in their studies.
2+ Reviews
10+ Question Solved
Related Book For 

Question Posted:
