

Figure 15(A) shows the graph of (x) = x. The close-up in Figure 15(B) shows that the
Question:
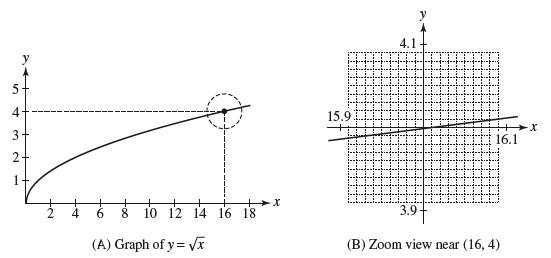
Figure 15(A) shows the graph of ƒ(x) = √x. The close-up in Figure 15(B) shows that the graph is nearly a straight line near x = 16. Estimate the slope of this line and take it as an estimate for ƒ'(16). Then compute ƒ'(16) with the limit definition and compare with your estimate.
Fantastic news! We've Found the answer you've been seeking!
Step by Step Answer:
From the closeup in Figure 15B the line ap...View the full answer

Answered By
Carly Cimino
As a tutor, my focus is to help communicate and break down difficult concepts in a way that allows students greater accessibility and comprehension to their course material. I love helping others develop a sense of personal confidence and curiosity, and I'm looking forward to the chance to interact and work with you professionally and better your academic grades.
12+ Reviews
21+ Question Solved
Related Book For 

Question Posted:
