

Figure 21 displays the graphs of r = sin 2 in r versus rectangular coordinates and
Question:
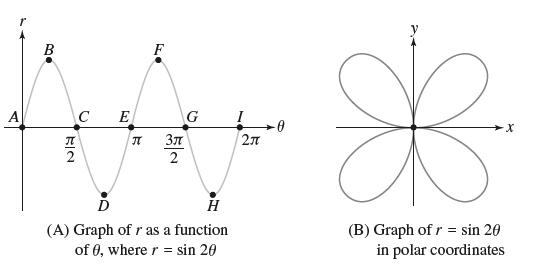
Figure 21 displays the graphs of r = sin 2θ in r versus θ rectangular coordinates and in polar coordinates, where it is a “rose with four petals.” Identify:
(a) The points in (B) corresponding to points A–I in (A).
(b) The parts of the curve in (B) corresponding to the angle intervals [0, π/2], [π/2, π], [π, 3π/2], and [3π/2 , 2π].
Fantastic news! We've Found the answer you've been seeking!
Step by Step Answer:
a The graph I gives the following polar coordinates of the labeled points ...View the full answer

Answered By
PALASH JHANWAR
I am a Chartered Accountant with AIR 45 in CA - IPCC. I am a Merit Holder ( B.Com ). The following is my educational details.
PLEASE ACCESS MY RESUME FROM THE FOLLOWING LINK: https://drive.google.com/file/d/1hYR1uch-ff6MRC_cDB07K6VqY9kQ3SFL/view?usp=sharing
3+ Reviews
10+ Question Solved
Related Book For 

Question Posted:
