

Figure 9 shows the graph of the position s of an object as a function of time
Question:
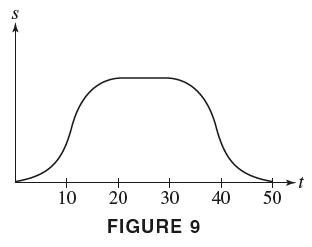
Figure 9 shows the graph of the position s of an object as a function of time t. For each interval [0, 10], [10, 20], and so on, indicate whether the acceleration is negative, zero, or positive.
Fantastic news! We've Found the answer you've been seeking!
Step by Step Answer:
Over the interval 0 10 the graph of s is bending upward so the acceleration is positive Over ...View the full answer

Answered By
John Kimutai
I seek to use my competencies gained through on the job experience and skills learned in training to carry out tasks to the satisfaction of users. I have a keen interest in always delivering excellent work
11+ Reviews
24+ Question Solved
Related Book For 

Question Posted:
