

Figure 9 shows the slope field for dy/dt = sin y sin t. Sketch the graphs of
Question:
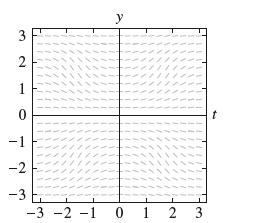
Figure 9 shows the slope field for dy/dt = sin y sin t. Sketch the graphs of the solutions with initial conditions y(0) = 1 and y(0) = −1. Show that y(t) = 0 is a solution and add its graph to the plot.
Fantastic news! We've Found the answer you've been seeking!
Step by Step Answer:
The sketches of the soluti...View the full answer

Answered By
Fahmin Arakkal
Tutoring and Contributing expert question and answers to teachers and students.
Primarily oversees the Heat and Mass Transfer contents presented on websites and blogs.
Responsible for Creating, Editing, Updating all contents related Chemical Engineering in
latex language
8+ Reviews
22+ Question Solved
Related Book For 

Question Posted:
