

Question: On the contour map in Figure 11: (a) Identify the points where = g for some scalar . (b) Identify the minimum and maximum
On the contour map in Figure 11:
(a) Identify the points where ∇ƒ = λ∇g for some scalar λ.
(b) Identify the minimum and maximum values of ƒ(x, y) subject to g(x, y) = 0.
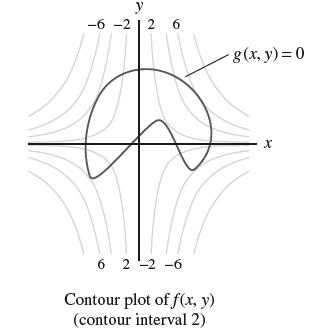
y -6-212 6 6 2-2-6 Contour plot of f(x, y) (contour interval 2) - g(x, y) =0 X
Step by Step Solution
★★★★★
3.25 Rating (160 Votes )
There are 3 Steps involved in it
1 Expert Approved Answer
Step: 1 Unlock

a The gradient Vg is orthogonal to the constraint curve ... View full answer
Question Has Been Solved by an Expert!
Get step-by-step solutions from verified subject matter experts
Step: 2 Unlock
Step: 3 Unlock