

Question: Refer to the function whose graph is shown in Figure 1. Compute the average rate of change of (x) over [0, 2]. What is
Refer to the function ƒ whose graph is shown in Figure 1.
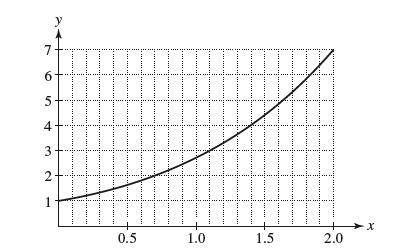
Compute the average rate of change of ƒ(x) over [0, 2]. What is the graphical interpretation of this average rate?
X 2.0 1.5 III 1.0 III 0.5 7 Z 1 2 4 5 9
Step by Step Solution
★★★★★
3.37 Rating (150 Votes )
There are 3 Steps involved in it
1 Expert Approved Answer
Step: 1 Unlock

The average rate of change of x over ... View full answer
Question Has Been Solved by an Expert!
Get step-by-step solutions from verified subject matter experts
Step: 2 Unlock
Step: 3 Unlock