

Question: The function (x, t) = t 1/2 e x2/t , whose graph is shown in Figure 27, models the temperature along a metal bar after
The function ƒ(x, t) = t−1/2e−x2/t, whose graph is shown in Figure 27, models the temperature along a metal bar after an intense burst of heat is applied at its center point.
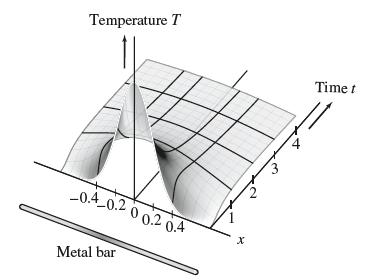
(a) Sketch the vertical traces at times t = 1, 2, 3. What do these traces tell us about the way heat diffuses through the bar?
(b) Sketch the vertical traces x = c for c = ±0.2, ±0.4. Describe how temperature varies in time at points near the center.
Temperature T -0.4-0.2 0 0.2 0.4 Metal bar X Time t
Step by Step Solution
3.38 Rating (151 Votes )
There are 3 Steps involved in it
a The vertical traces at times t 1 2 and 3 are z ex in the plane t 1 ... View full answer

Get step-by-step solutions from verified subject matter experts