

The graphs of x(t) and y(t) as functions of t are shown in Figure 16(A). Which of
Question:
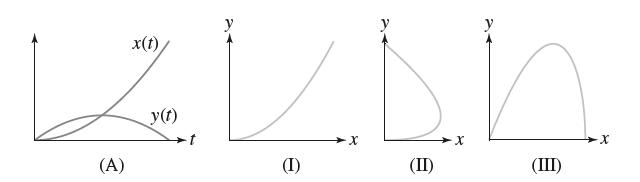
The graphs of x(t) and y(t) as functions of t are shown in Figure 16(A). Which of (I)–(III) is the plot of c(t) = (x(t), y(t))? Explain.
Fantastic news! We've Found the answer you've been seeking!
Step by Step Answer:
As seen in Figure 16A the xcoordinate is an increasing function of t whil...View the full answer

Answered By
Seema kuldeep
although I don't have an experience of teaching in a particular institute, previously I was an expert on Chegg and I have used to teach my batch mates and also my juniors.
1+ Reviews
10+ Question Solved
Related Book For 

Question Posted:
