

Use the contour map of (x, y) in Figure 8 to explain the following statements: (a)
Question:
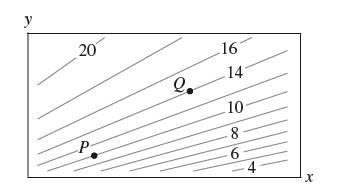
Use the contour map of ƒ(x, y) in Figure 8 to explain the following statements:
(a) ƒy is larger at P than at Q, and ƒx is more negative at P than at Q.
(b) ƒx(x, y) is decreasing as a function of y; that is, for any fixed value x = a, ƒx(a, y) is decreasing in y.
Fantastic news! We've Found the answer you've been seeking!
Step by Step Answer:
a A vertical segment through P meets more level curves than ...View the full answer

Answered By
Anjali Arora
Having the experience of 16 years in providing the best solutions with a proven track record of technical contribution and appreciated for leadership in enhancing team productivity, deliverable quality, and customer satisfaction. Expertise in providing the solution in Computer Science, Management, Accounting, English, Statistics, and Maths.
Also, do website designing and Programming.
Having 7 yrs of Project Management experience.
100% satisfactory answers.
3+ Reviews
10+ Question Solved
Related Book For 

Question Posted:
