

Question: Estimate the partial derivatives at P of the function whose contour map is shown in Figure 9. 4 2 0 2 4 6 8 21
Estimate the partial derivatives at P of the function whose contour map is shown in Figure 9.
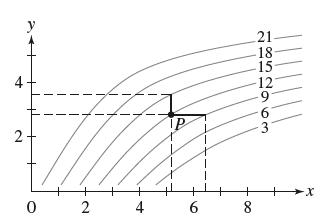
4 2 0 2 4 6 8 21 18- 15 12 -9 6 3 -X
Step by Step Solution
★★★★★
3.46 Rating (159 Votes )
There are 3 Steps involved in it
1 Expert Approved Answer
Step: 1 Unlock

The contour interval is m 3 To estimate the ... View full answer
Question Has Been Solved by an Expert!
Get step-by-step solutions from verified subject matter experts
Step: 2 Unlock
Step: 3 Unlock