

Question: A contour map for a function f is shown in Figure 14. Use it to estimate the values of f(1, 3) and f(4, 5). Figure
A contour map for a function f is shown in Figure 14. Use it to estimate the values of f(1, 3) and f(4, 5).
Figure 14
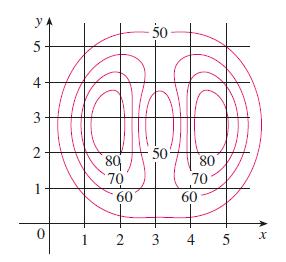
y 5 4 3 2 0 80 70 60 50 50 80 70 60 1 2 3 4 5 *
Step by Step Solution
★★★★★
3.29 Rating (152 Votes )
There are 3 Steps involved in it
1 Expert Approved Answer
Step: 1 Unlock

The point 1 3 lies partw... View full answer
Question Has Been Solved by an Expert!
Get step-by-step solutions from verified subject matter experts
Step: 2 Unlock
Step: 3 Unlock