

Question: A contour map for a function f is shown. Use it to estimate the values of f (-3, 3) and f (3, -2). What can
A contour map for a function f is shown. Use it to estimate the values of f (-3, 3) and f (3, -2). What can you say about the shape of the graph?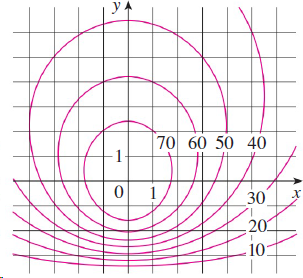
70 60 50 40 30 20 10:
Step by Step Solution
★★★★★
3.35 Rating (155 Votes )
There are 3 Steps involved in it
1 Expert Approved Answer
Step: 1 Unlock

The point 33 lies between the level curves with zvalues 50 and 60 Sinc... View full answer
Question Has Been Solved by an Expert!
Get step-by-step solutions from verified subject matter experts
Step: 2 Unlock
Step: 3 Unlock