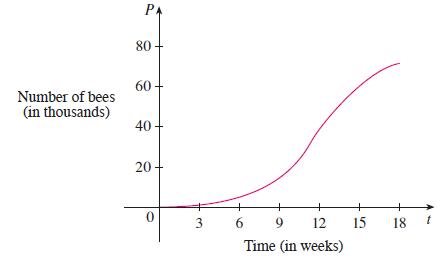
Figure 8 shows a population graph for Cyprian honeybees raised in an apiary. How does the rate
Question:
Figure 8 shows a population graph for Cyprian honeybees raised in an apiary. How does the rate of population increase change over time? When is this rate highest? Over what intervals is P concave upward or concave downward?
Figure 8

Transcribed Image Text:
Number of bees (in thousands) РА 80 60 40 20 0 درا 6 9 12 Time (in weeks) 15 18
Fantastic news! We've Found the answer you've been seeking!
Step by Step Answer:
Answer rating: 100% (QA)
By looking at the slope of the curve as t increases we see that the rate of increase of t...View the full answer

Answered By

Salmon ouma
I am a graduate of Maseno University, I graduated with a second class honors upper division in Business administration. I have assisted many students with their academic work during my years of tutoring. That has helped me build my experience as an academic writer. I am happy to tell you that many students have benefited from my work as a writer since my work is perfect, precise, and always submitted in due time. I am able to work under very minimal or no supervision at all and be able to beat deadlines.
I have high knowledge of essay writing skills. I am also well conversant with formatting styles such as Harvard, APA, MLA, and Chicago. All that combined with my knowledge in methods of data analysis such as regression analysis, hypothesis analysis, inductive approach, and deductive approach have enabled me to assist several college and university students across the world with their academic work such as essays, thesis writing, term paper, research project, and dissertation. I have managed to help students get their work done in good time due to my dedication to writing.
5.00+
4+ Reviews
16+ Question Solved
Related Book For 

Question Posted:
Students also viewed these Mathematics questions
-
Figure 8 shows the estimated number N of Internet users in Chile, based on data from the United Nations Statistics Division. (a) Estimate the rate of change of N at t = 2003.5. (b) Does the rate of...
-
In the Solow model, how does the rate of population growth affect the steady-state level of income? How does it affect the steady-state rate of growth?
-
Global Distribution of Earthquakes Earth scientists have determined that the global distribution of earthquakes is not random but follows a few relatively narrow belts that wind around Earth. Figure...
-
How do you identify the potential classes in a problem domain description?
-
Nastasi drove a propane gas truck for Synergy Gas. He had been active in getting a union certified as the bargaining agent for fellow employees. The unionization fight was bitter, and the company was...
-
Trulov.com is an online dating site. Trulov allows subscribers to create profiles, browse other profiles, take a relationship test, use the sites computerized matching system, and exchange messages....
-
Reconsider Problem 56. Determine which oven should be purchased based on an incremental annual worth analysis. Data from problem 56 Octavia Bakery is planning to purchase one of two ovens. The...
-
All Eyes Security Services Company provides security monitoring services. It employs four security specialists. Each specialist works an average of 180 hours a month. The companys controller has...
-
decribe the health sttsus of unit members (if any of the family describe below)Mother (29yo) and Father (32yo) 2 children (1 elementary, 1 high school) Origin: Mohawk (from Kahnawake) Address: 295,...
-
Find lim X-0 tan x - x 4.3
-
Calculate lim 04X In x 3x
-
Use the symbols , , |, and c to convert the following statements into compound events involving events A and B, where A = 5You purchase a notebook computer6 and B = {You vacation in Europe}: a. You...
-
once i find the profit maximizing level of output if all i have is marginal cost, average foxed cost, average variable cost, and market price in a perfectly competitive industry how do i find the...
-
Explain how would you implement the use of native language strategy in your instructional practice ?
-
Regarding the Glass Ceiling, what is the economic impact on women and minorities in today's society?
-
Explain why securitization led to an erosion of lending standards.
-
In this two-week project, you will research the cybersecurity industry and identify what you perceive to be the top three trends. You will then develop a research question about one specific issue...
-
Compute the future value of $ 1,900 continuously compounded for a. 7 years at a stated annual interest rate of 12 percent. b. 5 years at a stated annual interest rate of 10 percent. c. 12 years at a...
-
Don Griffin worked as an accountant at a local accounting firm for five years after graduating from university. Recently, he opened his own accounting practice, which he operates as a corporation....
-
A coin is flipped 5 times and comes up heads every time. Using the above data, find the p-value associated with the null hypothesis that the true probability of heads is 0.5. Is the result...
-
A coin is flipped 7 times and comes up heads 6 out of 7 times. Using the above data, find the p-value associated with the null hypothesis that the true probability of heads is 0.5. Is the result...
-
A coin is flipped 10 times and comes up heads 9 times. You have reason to suspect however, that the coin produces an excess of heads (and have told this to a friend in advance). Using the above data,...
-
For Hy-Vee Inc. identify one strategic goal and trace that goal through the tactical and operational levels of planning with one specific example at each level. Specify the appropriate person in the...
-
Factor V is a protein involved in the forming of blood clots. The higher the level of factor V, the faster the blood clots. The Auckland Blood Transfusion Service sterilizes its blood donations, but...
-
In 2022, the technology company Apple unveiled a "new healthcare strategy" focused on "empowering users on their personal health journey" and "supporting the health ecosystem by collaborating with...

Study smarter with the SolutionInn App


