

Interpret the position graph given in each figure by writing a very short story of what is
Question:
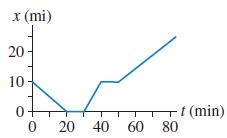
Interpret the position graph given in each figure by writing a very short “story” of what is happening. Be creative! Have characters and situations! Simply saying that “a car moves 100 meters to the right” doesn’t qualify as a story. Your stories should make specific reference to information you obtain from the graph, such as distance moved or time elapsed.
Fantastic news! We've Found the answer you've been seeking!
Step by Step Answer:
It was a typical summer day on the interstate I started 10 mi east of to...View the full answer

Answered By
Shaira grace
I have experience of more than ten years in handing academic tasks and assisting students to handle academic challenges. My level of education and expertise allows me communicate eloquently with clients and therefore understanding their nature and solving it successfully.
4+ Reviews
10+ Question Solved
Related Book For 
Physics For Scientists And Engineers A Strategic Approach With Modern Physics
ISBN: 9780321740908
3rd Edition
Authors: Randall D. Knight
Question Posted:
