

Question: For Questions 1 through 3, interpret the position graph given in each figure by writing a very short story of what is happening. Be creative!
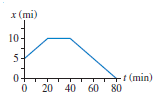
For Questions 1 through 3, interpret the position graph given in each figure by writing a very short €œstory€ of what is happening. Be creative! Have characters and situations! Simply saying that €œa car moves 100 meters to the right€ doesn€™t qualify as a story. Your stories should make specific reference to information you obtain from the graph, such as distance moved or time elapsed.
1. Figure Q2.1
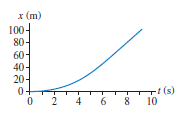
2. Figure Q2.2
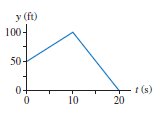
3. Figure Q3.3
x (mi) 10- 5- t (min) 0- O 20 40 60 80 x (m) 100- 80- 60- 40- 20- (s) 0 2 4 6 8 10
Step by Step Solution
3.51 Rating (171 Votes )
There are 3 Steps involved in it
1 I left my friends house 5 mi east of town and rode my bike east ... View full answer

Get step-by-step solutions from verified subject matter experts
Document Format (2 attachments)
1442_6054778b4222a_642041.pdf
180 KBs PDF File
1442_6054778b4222a_642041.docx
120 KBs Word File