

The table gives the midyear population P of Trinidad and Tobago, in thousands, from 1970 to 2015.
Question:
The table gives the midyear population P of Trinidad and Tobago, in thousands, from 1970 to 2015.
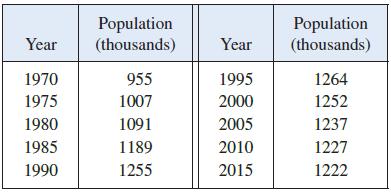
(a) Make a scatter plot of these data. Choose t − 0 to correspond to the year 1970.
(b) From the scatter plot, it appears that a logistic model might be appropriate if we first shift the data points downward (so that the initial P-values are closer to 0). Subtract 900 from each value of P. Then use a calculator or computer to obtain a logistic model for the shifted data.
(c) Add 900 to your model from part (b) to obtain a shifted logistic model for the original data. Graph the model with the data points from part (a) and comment on the accuracy of the model.
(d) If the model remains accurate, what do you predict for the future population of Trinidad and Tobago?
Step by Step Answer:
a b After subtracting 900 from each value of P we get the log...View the full answer


Calculus Early Transcendentals
ISBN: 9781337613927
9th Edition
Authors: James Stewart, Daniel K. Clegg, Saleem Watson, Lothar Redlin
