

Consider the graph of the function f shown in the figure. Answer the following questions by referring
Question:
Consider the graph of the function f shown in the figure. Answer the following questions by referring to the points A–I.
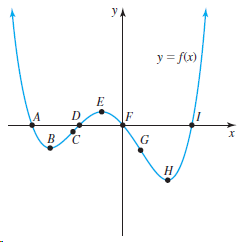
a. Which points correspond to the roots (zeros) of f?
b. Which points on the graph correspond to high points or peaks (soon to be called local maximum values of f)?
c. Which points on the graph correspond to low points or valleys (soon to be called local minimum values of f)?
d. As you move along the curve in the positive x-direction, at which point is the graph rising most rapidly?
e. As you move along the curve in the positive x-direction, at which point is the graph falling most rapidly?
Fantastic news! We've Found the answer you've been seeking!
Step by Step Answer:
a The zeros of f are the points where the graph crosses the xaxis so these are points A D ...View the full answer

Answered By
Muhammad Ghyas Asif
It is my obligation to present efficient services to my clients by providing a work of quality, unique, competent and relevant. I hope you have confidence in me and assign me the order and i promise to follow all the instructions and keep time.
109+ Reviews
203+ Question Solved
Related Book For 

Calculus Early Transcendentals
ISBN: 978-0321947345
2nd edition
Authors: William L. Briggs, Lyle Cochran, Bernard Gillett
Question Posted:
