

Consider the graph of the function g shown in the figure. a. Give the approximate roots (zeros)
Question:
Consider the graph of the function g shown in the figure.
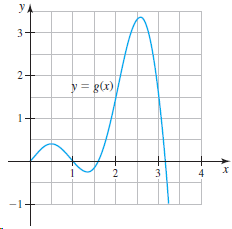
a. Give the approximate roots (zeros) of g.
b. Give the approximate coordinates of the high points or peaks (soon to be called local maximum values of f).
c. Give the approximate coordinates of the low points or valleys (soon to be called local minimum values of f).
d. Imagine moving along the curve in the positive x-direction on the interval [0, 3]. Give the approximate coordinates of the point at which the graph is rising most rapidly.
e. Imagine moving along the curve in the positive x-direction on the interval [0, 3]. Give the approximate coordinates of the point at which the graph is falling most rapidly.
Step by Step Answer:
a The zeros of g appear to be at x 0 x 1 x 16 and x 315 b The two peaks of g appear to be ...View the full answer


Calculus Early Transcendentals
ISBN: 978-0321947345
2nd edition
Authors: William L. Briggs, Lyle Cochran, Bernard Gillett
