

Question: Scientists often use the logistic growth function to model population growth, where P 0 is the initial population at time t = 0, K is
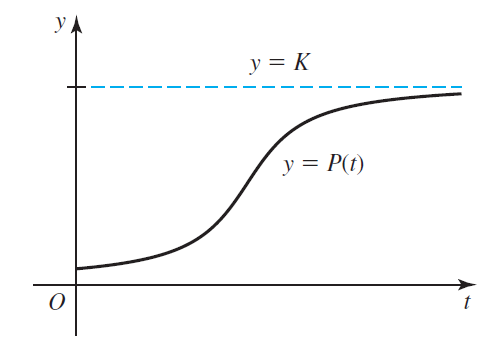
Scientists often use the logistic growth function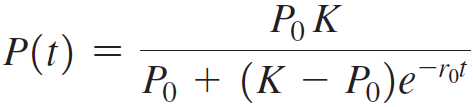 to model population growth, where P0 is the initial population at time t = 0, K is the carrying capacity, and r0 is the base growth rate. The carrying capacity is a theoretical upper bound on the total population that the surrounding environment can support. The figure shows the sigmoid (S-shaped) curve associated with a typical logistic model.
The relative growth rate r of a function f measures the rate of change of the function compared to its value at a particular point. It is computed as r(t) = f'(t)/f(t).
a. Confirm that the relative growth rate in 1999 (t = 0) for the logistic model in Exercise 94 is r(0) = P'(0)/P(0) = 0.015. This means the world’s population was growing at 1.5% per year in 1999.
b. Compute the relative growth rate of the world’s population in 2010 and 2020. What appears to be happening to the relative growth rate as time increases?
c. Evaluate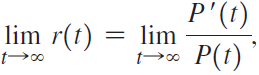 where P(t) is the logistic growth function from Exercise 94. What does your answer say about populations that follow a logistic growth pattern?
PoK P(t) Po + (K Po)ero* y, y = K y = P(t)
Step by Step Solution
3.52 Rating (165 Votes )
There are 3 Steps involved in it
a lnPt ln310 10 ln2 3e 0025t so the population is growing at 15 per ... View full answer

Get step-by-step solutions from verified subject matter experts