

Suppose the following graph represents the number of bacteria in a culture t hours after the start
Question:
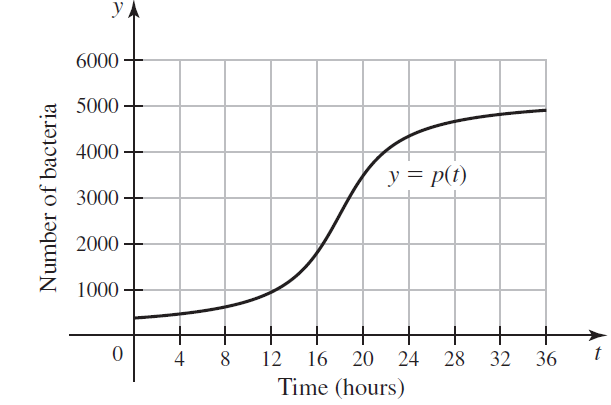
Suppose the following graph represents the number of bacteria in a culture t hours after the start of an experiment.
a. At approximately what time is the instantaneous growth rate the greatest, for 0 ≤ t ≤ 36? Estimate the growth rate at this time.
b. At approximately what time in the interval 0 ≤ t ≤ 36 is the instantaneous growth rate the least? Estimate the instantaneous growth rate at this time.
c. What is the average growth rate over the interval 0 ≤ t ≤ 36?
Fantastic news! We've Found the answer you've been seeking!
Step by Step Answer:
a The graph has the steepest slope at about t 18 A...View the full answer

Answered By
Krishnavendra Y
I am a self motivated financial professional knowledgeable in; preparation of financial reports, reconciling and managing accounts, maintaining cash flows, budgets, among other financial reports. I possess strong analytical skills with high attention to detail and accuracy. I am able to act quickly and effectively when dealing with challenging situations. I have the ability to form positive relationships with colleagues and I believe that team work is great key to performance. I always deliver quality, detailed, original (0% plagiarism), well-researched and critically analyzed papers.
4+ Reviews
10+ Question Solved
Related Book For 

Calculus Early Transcendentals
ISBN: 978-0321947345
2nd edition
Authors: William L. Briggs, Lyle Cochran, Bernard Gillett
Question Posted:
