

The graph of g in the figure has vertical asymptotes at x = 2 and x =
Question:
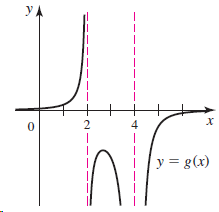
The graph of g in the figure has vertical asymptotes at x = 2 and x = 4. Analyze the following limits.
a. limx→2- g(x)
b. limx→2+ g(x)
c. limx→2 g(x)
d. limx→4- g(x)
e. limx→4+ g(x)
f. limx→4 g(x)
Fantastic news! We've Found the answer you've been seeking!
Step by Step Answer:
a b ...View the full answer

Answered By
Arvind Ramadurai
I am currently a final year Computer Science student at the National Institute of Technology Goa, which is one of India's finest technical institutes. I love everything in Mathematics and Computer Science and would enjoy to learn and teach to other students. I am very proficient in Mathematics, especially Algebra and Geometry, scoring a perfect 10/10 GPA in all four semesters. I am a part of the "Mentors without Borders" program that aims to teach unprivileged children programming. At college, I am a part of a club where I teach juniors about Machine Learning and Artificial Intelligence and how every aspect of life has some sort of Mathematics involved in it. Learn from me to get the best experience!
0 Reviews
10+ Question Solved
Related Book For 

Calculus Early Transcendentals
ISBN: 978-0321947345
2nd edition
Authors: William L. Briggs, Lyle Cochran, Bernard Gillett
Question Posted:
