

Table 2.3 gives the amount of federal spending in billions of dollars for agriculture for several years.
Question:
Table 2.3 gives the amount of federal spending in billions of dollars for agriculture for several years.
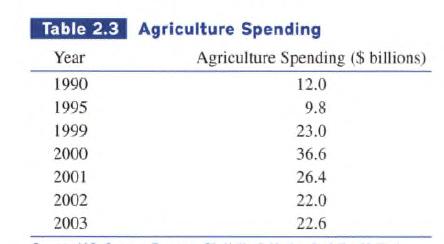
(a) Let x = 0 represent 1990, x = 1 represent 1991, and so forth. Make a scatter plot of the data.
(b) Let P represent the point corresponding to 2003, Q1 the point corresponding to 2000, Q2 the point corresponding to 2001, and Q3 the point corresponding to 2002. Find the slope of the secant line PQ, for i = 1, 2, 3.
Fantastic news! We've Found the answer you've been seeking!
Step by Step Answer:
a To make a scatter plot of the data we need to plot the year represented by x on the horizontal axi...View the full answer

Answered By
Darwin Romero
I use a hands-on technique and am approachable to my students. I incorporate fun into my lessons when possible. And while my easy-going style is suitable for many subjects and grades, I am also able to adapt my style to the needs of the student. I can describe myself as friendly, enthusiastic and respectful. As a teacher, we can easily get respect from the students if they would feel respected first
0 Reviews
10+ Question Solved
Related Book For 
Calculus Graphical, Numerical, Algebraic
ISBN: 9780132014083
3rd Edition
Authors: Ross L. Finney, Franklin D. Demana, Bert K. Waits, Daniel Kennedy
Question Posted:
