

Table 2.4 gives the population of Florida for several years. (a) Let x = 0 represent 1990,
Question:
Table 2.4 gives the population of Florida for several years.
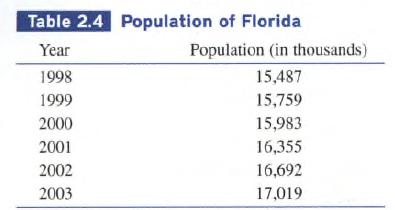
(a) Let x = 0 represent 1990, x = I represent 1991, and so forth. Make a scatter plot for the data.
(b) Let P represent the point corresponding to 2003, Q1 the point corresponding to 1998, Q2 the point corresponding to 1999,.... and Q5 the point corresponding to 2002. Find the slope of the secant the PQ1 for i = 1, 2, 3, 4, 5.
(c) Predict the rate of change of population in 2003.
(d) Find a linear regression equation for the data, and use it to calculate the rate of the population in 2003.
Fantastic news! We've Found the answer you've been seeking!
Step by Step Answer:
a To make a scatter plot for the data we can plot the year on the horizontal axis with x 0 representing 1998 and the population on the vertical axis The resulting scatter plot is 18000 17000 16000 15000 14000 0 1 2 3 4 5 6 Year b Let P represent ...View the full answer

Answered By
Brian Otieno
I'm Brian , an experienced professional freelancer with countless hours of success in freelancing many subjects in different disciplines. Specifically, I have handled many subjects and excelled in many disciplines. I have worked on many Computer Science projects and have been able to achieve a lot in that field. Additionally, I have handled other disciplines like History, Humanities, Social Sciences, Political science, Health care and life science, and Religion / Theology. My experience generally in these subjects has made me able to deliver high-quality projects in a very timely fashion. I am very reliable at my job and will get the work done in time, no matter what. In Addition, I have managed to ensure that the work meets my client's expectations and does not cause an error. I am a hard-working and diligent person who is highly responsible for everything I do. Generally, Freelancing has made me more accountable for doing my job. Additionally, I have had a passion for writing for the last seven years in this field.
0 Reviews
10+ Question Solved
Related Book For 
Calculus Graphical, Numerical, Algebraic
ISBN: 9780132014083
3rd Edition
Authors: Ross L. Finney, Franklin D. Demana, Bert K. Waits, Daniel Kennedy
Question Posted:
