

A companys annual profit (in millions of dollars) for the first 5 years of operation is shown
Question:
A company’s annual profit (in millions of dollars) for the first 5 years of operation is shown in this table:
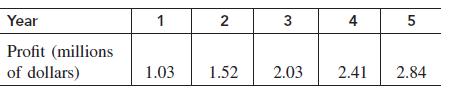
a. Plot these data on a graph.
b. Find the equation of the least-squares line through the data.
c. Use the least-squares line to predict the company’s 6th year profit.
Fantastic news! We've Found the answer you've been seeking!
Step by Step Answer:
Let x denote the year of operation an...View the full answer

Answered By
Utsab mitra
I have the expertise to deliver these subjects to college and higher-level students. The services would involve only solving assignments, homework help, and others.
I have experience in delivering these subjects for the last 6 years on a freelancing basis in different companies around the globe. I am CMA certified and CGMA UK. I have professional experience of 18 years in the industry involved in the manufacturing company and IT implementation experience of over 12 years.
I have delivered this help to students effortlessly, which is essential to give the students a good grade in their studies.
2+ Reviews
10+ Question Solved
Related Book For 

Calculus For Business, Economics And The Social And Life Sciences
ISBN: 9780073532387
11th Brief Edition
Authors: Laurence Hoffmann, Gerald Bradley, David Sobecki, Michael Price
Question Posted:
