

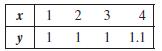
Question: Consider the following table of data. (a) Calculate the correlation coefficient. (b) Sketch a graph of the data. (c) Based on how closely the data
Consider the following table of data.
(a) Calculate the correlation coefficient.
(b) Sketch a graph of the data.
(c) Based on how closely the data fit a straight line, is your answer to part (a) surprising? Discuss the extent to which the correlation coefficient describes how well the data fit a horizontal line.
1 y 1 11 1 2 3 4 1.1
Step by Step Solution
★★★★★
3.28 Rating (166 Votes )
There are 3 Steps involved in it
1 Expert Approved Answer
Step: 1 Unlock

a b c Yes because the data points are either on or very close to t... View full answer
Question Has Been Solved by an Expert!
Get step-by-step solutions from verified subject matter experts
Step: 2 Unlock
Step: 3 Unlock