

For each of five different years, the accompanying table gives the percentage of high school students who
Question:
For each of five different years, the accompanying table gives the percentage of high school students who had used cocaine at least once in their lives up to that year:
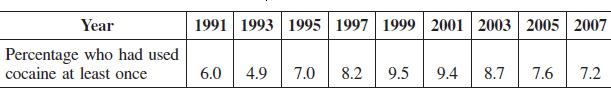
a. Plot these data on a graph, with the number of years after 1991 on the x axis and the percentage of cocaine users on the y axis.
b. Find the equation of the least-squares line for the data.
c. Use the least-squares line to predict the percentage of high school students who used cocaine at least once by the year 2013.
Fantastic news! We've Found the answer you've been seeking!
Step by Step Answer:
a b Let x be the number of years after 1991 and y the cocaine ...View the full answer

Answered By
Muhammad Rehan
Enjoy testing and can find bugs easily and help improve the product quality.
10+ Reviews
10+ Question Solved
Related Book For 

Calculus For Business, Economics And The Social And Life Sciences
ISBN: 9780073532387
11th Brief Edition
Authors: Laurence Hoffmann, Gerald Bradley, David Sobecki, Michael Price
Question Posted:
