

In economics, the inflation graph in Figure 2.2 is called the Phillips curve, after A. W. Phillips,
Question:
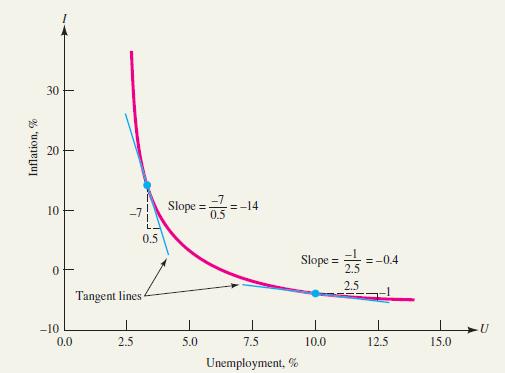
In economics, the inflation graph in Figure 2.2 is called the Phillips curve, after A. W. Phillips, a New Zealander associated with the London School of Economics. Until Phillips published his ideas in the 1950s, many economists believed that unemployment and inflation were linearly related. Read an article on the Phillips curve (the source cited with Figure 2.2 would be a good place to start), and write a paragraph on the nature of unemployment in the U.S. economy.
Figure 2.2.
Fantastic news! We've Found the answer you've been seeking!
Step by Step Answer:
The nature of unemployment in the US economy can be understood through the lens of the Phillips ...View the full answer

Answered By
User l_917591
As a Business Management graduate from Moi University, I had the opportunity to work as a tutor for undergraduate students in the same field. This experience allowed me to apply the theoretical knowledge I had gained in a practical setting, while also honing my teaching and communication skills.
As a tutor, I was responsible for conducting tutorial sessions, grading assignments and exams, and providing feedback and support to my students. I also assisted with the preparation of course materials and collaborated with other tutors and professors to ensure consistency in teaching and assessment.
0 Reviews
10+ Question Solved
Related Book For 

Calculus For Business, Economics And The Social And Life Sciences
ISBN: 9780073532387
11th Brief Edition
Authors: Laurence Hoffmann, Gerald Bradley, David Sobecki, Michael Price
Question Posted:
