

In Exercises 2428, estimate the area under each curve by summing the area of rectangles. Use the
Question:
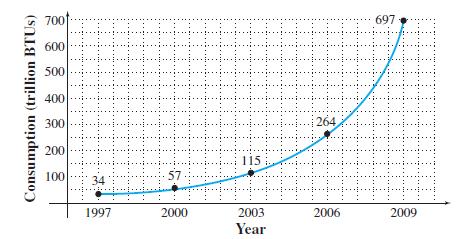
In Exercises 24–28, estimate the area under each curve by summing the area of rectangles. Use the left endpoints, then the right endpoints, then give the average of those answers.
The following graph shows the U.S. wind energy consumption (trillion BTUs) for various years. Estimate the total consumption for the 12-year period from 1997 to 2009 using rectangles of width 3 years.
Fantastic news! We've Found the answer you've been seeking!
Step by Step Answer:
To estimate the area under the curve using rectangles of width 3 years we will use the values provided at the left and right endpoints of these interv...View the full answer

Answered By
Aanchal Khulve
I have been teaching students for almost 9 years now. Initially, I started as a part-time teacher for under-privileged students while I was still in college. I then starting teaching and helping my neighborhood students with studies after office hours during my time as a Software Engineer in IT industry. I have been teaching full time since Mar 2018 as I left my job and started pursuing the field that I love the most i.e. Education. My students respect me a lot and rely on me for the most "impenetrable" problems. I feel very satisfied and happy when I see them smile as they get to the solution with my help. My focus lies in teaching students the basic concepts of the subjects with diligence so that their applications are well understood and problem-solving becomes easy. Around 90% of my students have seen improvement in their marks after joining my classes.
0 Reviews
10+ Question Solved
Related Book For 

Calculus With Applications
ISBN: 9780321831101
10th Edition
Authors: Margaret L Lial, Raymond N Greenwell, Nathan P Ritchey
Question Posted:
