

New car sales have increased at a roughly linear rate. Sales, in millions of vehicles, from 2000
Question:
New car sales have increased at a roughly linear rate. Sales, in millions of vehicles, from 2000 to 2007, are given in the table below. Source: National Automobile Dealers Association. Let x represent the number of years since 2000.
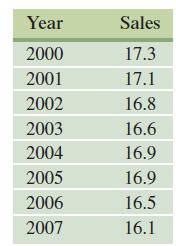
a. Find the equation of the least squares line and the correlation coefficient.
b. Find the equation of the least squares line using only the data for every other year starting with 2000, 2002, and so on. Find the correlation coefficient.
c. Compare your results for parts a and b. What do you find? Why do you think this happens?
Fantastic news! We've Found the answer you've been seeking!
Step by Step Answer:
a To find the equation of the least squares line and the correlation coefficient we can use linear r...View the full answer

Answered By
Sayee Sreenivas G B
I have extensive tutoring experience, having worked as a private tutor for over three years. I have tutored students from different academic levels, including high school, undergraduate, and graduate levels. My tutoring experience has taught me to be patient, attentive to student needs, and effective in communicating difficult concepts in simple terms.
I have a strong background in statistics, probability theory, data analysis, and data visualization. I am proficient in using statistical software such as R, Python, and SPSS, which are commonly used in academic research and data analysis. Additionally, I have excellent communication and interpersonal skills, which enable me to establish rapport with students, understand their learning styles, and adapt my teaching approach to meet their needs.
I am passionate about teaching and helping students achieve their academic goals.
0 Reviews
10+ Question Solved
Related Book For 

Calculus With Applications
ISBN: 9780321831101
10th Edition
Authors: Margaret L Lial, Raymond N Greenwell, Nathan P Ritchey
Question Posted:
