

The accompanying graph shows how the growth rate R(T) of a bacterial colony changes with temperature T.*
Question:
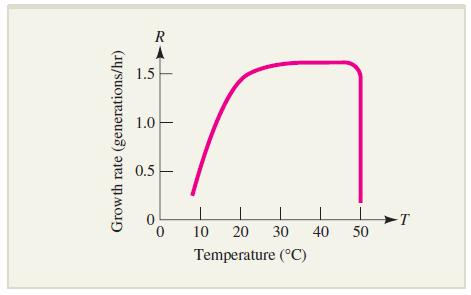
The accompanying graph shows how the growth rate R(T) of a bacterial colony changes with temperature T.*
a. Over what range of values of T does the growth rate R(T) double?
b. What can be said about the growth rate for 25
c. What happens when the temperature reaches roughly 45ºC? Does it make sense to compute
![]()
Fantastic news! We've Found the answer you've been seeking!
Step by Step Answer:
a The growth rate doubles from about 05 generationhr to 10 gener...View the full answer

Answered By
Nyron Beeput
I am an active educator and professional tutor with substantial experience in Biology and General Science. The past two years I have been tutoring online intensively with high school and college students. I have been teaching for four years and this experience has helped me to hone skills such as patience, dedication and flexibility. I work at the pace of my students and ensure that they understand.
My method of using real life examples that my students can relate to has helped them grasp concepts more readily. I also help students learn how to apply their knowledge and they appreciate that very much.
1+ Reviews
10+ Question Solved
Related Book For 

Calculus For Business, Economics And The Social And Life Sciences
ISBN: 9780073532387
11th Brief Edition
Authors: Laurence Hoffmann, Gerald Bradley, David Sobecki, Michael Price
Question Posted:
