

Question: The enrollment in Head Start for some recent years is included in the table. (a) Plot the points from the table using 0 for 1970,
The enrollment in Head Start for some recent years is included in the table.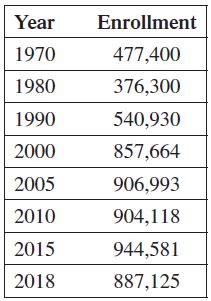
(a) Plot the points from the table using 0 for 1970, and so on.
(b) Use the quadratic regression feature of a graphing calculator to get a quadratic function that approximates the data. Graph the function on the same window as the scatterplot.
(c) Use cubic regression to get a cubic function that approximates the data. Graph the function on the same window as the scatterplot.
(d) Use the functions from parts (b) and (c) to predict the enrollment in Head Start in 2025.
(e) Which of the two functions in parts (b) and (c) appears to be a better fit for the data? Explain your reasoning.
Year Enrollment 1970 477,400 1980 376,300 1990 540,930 2000 857,664 2005 906,993 2010 904,118 2015 944,581 2018 887,125
Step by Step Solution
3.36 Rating (168 Votes )
There are 3 Steps involved in it
a b y 95037t 2 12771t 383087 c y 30486t 3 22242... View full answer

Get step-by-step solutions from verified subject matter experts