

The accompanying table gives the Dow Jones Industrial Average (DJIA) at the close of the first trading
Question:
The accompanying table gives the Dow Jones Industrial Average (DJIA) at the close of the first trading day of the year shown:
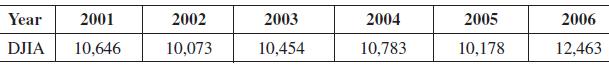
a. Plot these data on a graph, with the number of years after 2001 on the x axis and the DJIA on the y axis.
b. Find the equation of the least-squares line for the data.
c. What does the least-squares line predict for the DJIA on the first day of trading in 2008? Use the Internet to find where the DJIA actually closed on that day (January 2, 2008), and compare with the predicted value.
Fantastic news! We've Found the answer you've been seeking!
Step by Step Answer:
a b For this data n 6 and where x represents the num...View the full answer

Answered By
Gabriela Rosalía Castro
I have worked with very different types of students, from little kids to bussines men and women. I have thaught at universities, schools, but mostly in private sessions for specialized purpuses. Sometimes I tutored kids that needed help with their classes at school, some others were high school or college students that needed to prepare for an exam to study abroud. Currently I'm teaching bussiness English for people in bussiness positions that want to improve their skills, and preparing and ex-student to pass a standarized test to study in the UK.
1+ Reviews
10+ Question Solved
Related Book For 

Calculus For Business, Economics And The Social And Life Sciences
ISBN: 9780073532387
11th Brief Edition
Authors: Laurence Hoffmann, Gerald Bradley, David Sobecki, Michael Price
Question Posted:
