

The atmospheric pressure (in millibars) at a given altitude (in meters) is listed in the table. (a)
Question:
The atmospheric pressure (in millibars) at a given altitude (in meters) is listed in the table.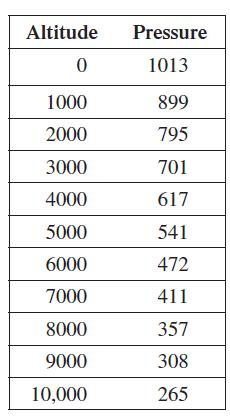 (a) Find functions of the form P = a • bx, P = mx + b, and P = 1/(ax + b) that fit the data at x = 0 and x = 10,000, where P is the pressure and x is the altitude.
(b) Plot the data in the table and graph the three functions found in part (a). Which function best fits the data?
(c) Use the best-fitting function from part (b) to predict pressure at 1500 m and 11,000 m. Compare your answers to the true values of 846 millibars and 227 millibars, respectively.
(d) If you have a graphing calculator or computer program with an exponential regression feature, use it to find an exponential function that approximately fits the data. How does this answer compare with the answer to part (b)?
Step by Step Answer:
a When x 0 When x 10000 P 265 First we fit P a b x 1013 a b 0 a 101...View the full answer


