

The curve shown gives the rate that an investment accumulates income (in dollars per year). Use rectangles
Question:
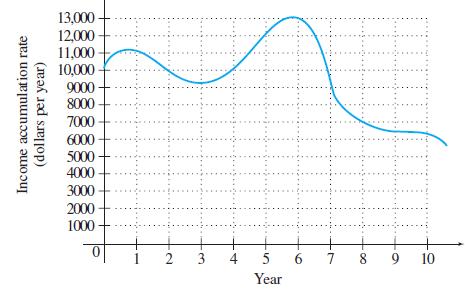
The curve shown gives the rate that an investment accumulates income (in dollars per year). Use rectangles of width 2 units and height determined by the function value at the midpoint to find the total income accumulated over 10 years.
Fantastic news! We've Found the answer you've been seeking!
Step by Step Answer:
To find the total income accumulated over 10 years using rectangles of width 2 units and height determined by the function value at the midpoint you c...View the full answer

Answered By
Akash M Rathod
I have been utilized by educators and students alike to provide individualized assistance with everything from grammar and vocabulary to complex problem-solving in various academic subjects. I can provide explanations, examples, and practice exercises tailored to each student's individual needs, helping them to grasp difficult concepts and improve their skills.
My tutoring sessions are interactive and engaging, utilizing a variety of tools and resources to keep learners motivated and focused. Whether a student needs help with homework, test preparation, or simply wants to improve their skills in a particular subject area, I am equipped to provide the support and guidance they need to succeed.
0 Reviews
10+ Question Solved
Related Book For 

Calculus With Applications
ISBN: 9780321831101
10th Edition
Authors: Margaret L Lial, Raymond N Greenwell, Nathan P Ritchey
Question Posted:
