

The enrollment in Head Start for some recent years is included in the table. a. Plot the
Question:
The enrollment in Head Start for some recent years is included in the table.
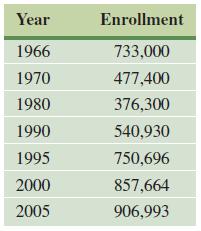
a. Plot the points from the table using 0 for 1960, and so on.
b. Use the quadratic regression feature of a graphing calculator to get a quadratic function that approximates the data. Graph the function on the same window as the scatterplot.
c. Use cubic regression to get a cubic function that approximates the data. Graph the function on the same window as the scatterplot.
d. Which of the two functions in part b and c appears to be a better fit for the data? Explain your reasoning.
Fantastic news! We've Found the answer you've been seeking!
Step by Step Answer:
a To plot the points from the table well represent the years t on the xaxis and the enrollment in He...View the full answer

Answered By
Anyango Anyango
Immediately after I finished secondary school waiting to join university I was practising as a tutor of business because of my passion and interests. I have done that for the longest time even though pursuing a different carrier.
I also love playing with figures to solve mathematical problems.
Above all this, I love assisting learners to scale higher and get good grades. Most of the time I would volunteer to teach students in the neighbourhood with their assignments.So far I have seen most of them improve well in their academics and even pass with flying colours and able to join the university.
0 Reviews
10+ Question Solved
Related Book For 

Calculus With Applications
ISBN: 9780321831101
10th Edition
Authors: Margaret L Lial, Raymond N Greenwell, Nathan P Ritchey
Question Posted:
