

The following chart shows how the percentage of eighth graders, tenth graders, and twelfth graders who have
Question:
The following chart shows how the percentage of eighth graders, tenth graders, and twelfth graders who have used marijuana in their lifetime has varied in recent years.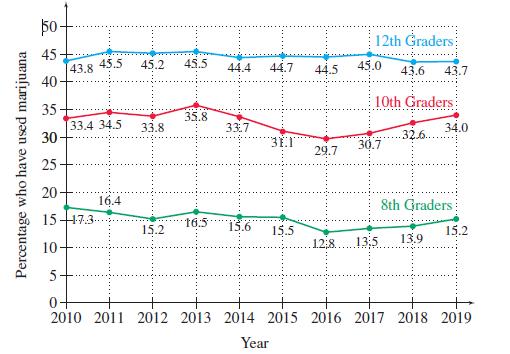
(a) Find the average annual rate of change in the percent of eighth graders who have used marijuana in their lifetime over the period from 2010 to 2014 and over the period from 2015 to 2019. Then calculate the annual rate of change for 2010–2019.
(b) Repeat part (a) for tenth graders.
(c) Repeat part (a) for twelfth graders.
Fantastic news! We've Found the answer you've been seeking!
Step by Step Answer:
Let Dt represent the percent of students 8th 10th or 12th grader...View the full answer

Answered By
Surojit Das
I have vast knowledge in the field of Mathematics, Business Management and Marketing. Besides, I have been teaching on the topics Management leadership, Business Administration, Human Resource Management, Business Communication, Accounting, Auditing, Organizer Behaviours, Business Writing, Essay Writing, Copy Writing, Blog Writing since 2020. It is my personality to act quickly in any emergency situations when students need my services. I am very professional and serious in every questions students asked me at the time of dealing any projects. I have been serving detailed, quality, properly analysed research paper through the years.
91+ Reviews
278+ Question Solved
Related Book For 

Question Posted:
