

The following table gives the life expectancy at birth of females born in the United States in
Question:
The following table gives the life expectancy at birth of females born in the United States in various years from 1970 to 2005.
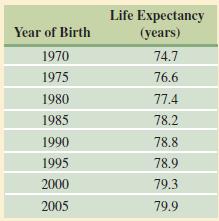
1. Find an equation for the least squares line for these data, using year of birth as the independent variable.
2. Use your regression equation to guess a value for the life expectancy of females born in 1900.
3. Compare your answer with the actual life expectancy for females born in 1900, which was 48.3 years. Are you surprised?
4. Find the life expectancy predicted by your regression equation for each year in the table, and subtract it from the actual value in the second column. This gives you a table of residuals. Plot your residuals as points on a graph.
5. Now look at the residuals as a fresh data set, and see if you can sketch the graph of a smooth function that fits the residuals well. How easy do you think it will be to predict the life expectancy at birth of females born in 2015?
6. What will happen if you try linear regression on the residuals? If you’re not sure, use your calculator or software to find the regression equation for the residuals. Why does this result make sense?
7. Since most of the females born in 1995 are still alive, how did the Public Health Service come up with a life expectancy of 78.9 years for these women?
8. Go to the website WolframAlpha.com and enter: “linear fit {1970,74.7}, {1975,76.6}, etc.,” putting in all the data from the table. Discuss how the solution compares with the solutions provided by a graphing calculator and by Microsoft Excel.
Step by Step Answer:
Lets go through each question step by step 1 To find the equation for the least squares line for the given data well use linear regression with the ye...View the full answer


Calculus With Applications
ISBN: 9780321831101
10th Edition
Authors: Margaret L Lial, Raymond N Greenwell, Nathan P Ritchey
