

The following table gives the median age at their first marriage of women in the United States
Question:
The following table gives the median age at their first marriage of women in the United States for some selected years.
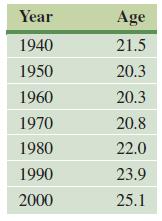
a. Plot the data using x = 40 for 1940, and so on.
b.Would a linear or quadratic function best model this data? Explain.
c. If your graphing calculator has a regression feature, find the quadratic function that best fits the data. Graph this function on the same calculator window as the data. (On a TI-84 Plus calculator, press the STAT key, and then select the CALC menu. QuadReg is item 5. The command QuadReg L1,L2,Y1 finds the quadratic regression equation for the data in L1 and L2 and stores the function in y1.)
d. Find a quadratic function defined by f(x) = a(x – h)2 + k that models the data using (60, 20.3) as the vertex and then choosing (100, 25.1) as a second point to determine the value of a.
e. Graph the function from part d on the same calculator window as the data and function from part c. Do the graphs of the two functions differ by much?
Step by Step Answer:

This question has not been answered yet.
You can Ask your question!


Calculus With Applications
ISBN: 9780321831101
10th Edition
Authors: Margaret L Lial, Raymond N Greenwell, Nathan P Ritchey
