

The following table shows global estimated percentages in recent years of infants tested for HIV within two
Question:
The following table shows global estimated percentages in recent years of infants tested for HIV within two months of being born to women having HIV.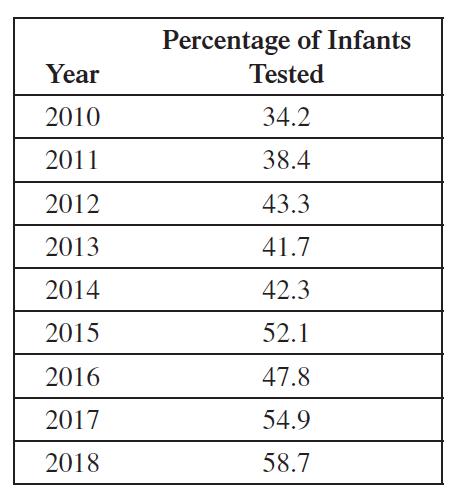
(a) Plot the data on a graphing calculator, letting t = 0 correspond to the year 2010.
(b) Using the regression feature on your calculator, find a linear, a quadratic, a cubic, and an exponential function that model these data.
(c) Plot the four functions with the data on the same coordinate axes. Which function or functions best capture the behavior of the data over the years plotted?
(d) Find the number of cases predicted by each function for 2022. Which of these are realistic? Explain.
Fantastic news! We've Found the answer you've been seeking!
Step by Step Answer:
a b y 278t 348 y 00919t 2 205t 357 y 00635t 3 0670t 2 434t 346 y 3...View the full answer

Answered By
Irfan Ali
I have a first class Accounting and Finance degree from a top university in the World. With 5+ years experience which spans mainly from the not for profit sector, I also have vast experience in preparing a full set of accounts for start-ups and small and medium-sized businesses. My name is Irfan Ali and I am seeking a wide range of opportunities ranging from bookkeeping, tax planning, business analysis, Content Writing, Statistic, Research Writing, financial accounting, and reporting.
249+ Reviews
530+ Question Solved
Related Book For 

Question Posted:
