

The following table shows the number of drug overdose deaths involving nonprescription synthetic narcotics (primarily fentanyl) in
Question:
The following table shows the number of drug overdose deaths involving nonprescription synthetic narcotics (primarily fentanyl) in recent years.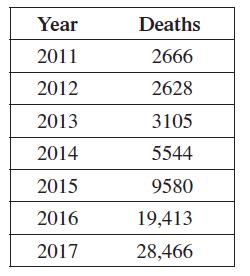
(a) Letting t represent the years since 2010, find a function of the form y = y0ekt that fits the data at 2011 and 2016.
(b) If you have a graphing calculator or computer program with an exponential regression feature, find an exponential growth function that best fits the data.
(c) Use a graphing calculator to plot the data and your functions from parts (a) and (b).
(d) Predict the number number of drug overdose deaths involving nonprescription synthetic narcotics in the year 2025 based on the functions from parts (a) and (b). Which prediction, if either, is more realistic?
Fantastic news! We've Found the answer you've been seeking!
Step by Step Answer:
y y 0 e kt a For 2011 t 1 y 2666 For 2016 t 6 y 19413 Substitute this value int...View the full answer

Answered By
Allan Simiyu
I am an adroit Writer. I am a dedicated writer having worked as a writer for 3 years now. With this, I am sure to ace in the field by helping students break down abstract concepts into simpler ideas.
8+ Reviews
54+ Question Solved
Related Book For 

Question Posted:
