

The graph shows the total inventory of nuclear weapons held by the United States and by the
Question:
The graph shows the total inventory of nuclear weapons held by the United States and by the Soviet Union and its successor states from 1945 to 2010.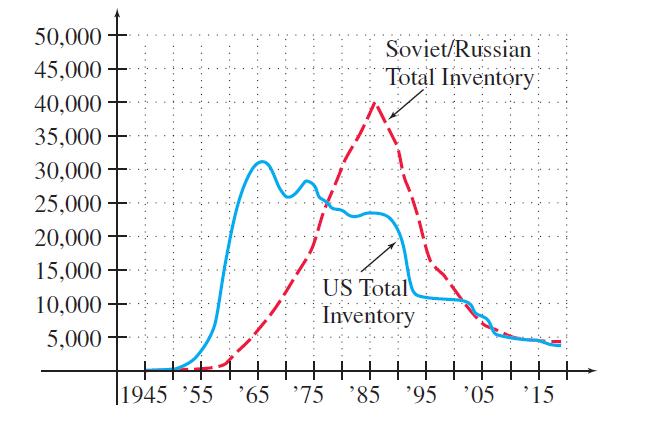
(a) In what years was the U.S. total inventory of weapons at a relative maximum?
(b) When the U.S. total inventory of weapons was at the largest relative maximum, is the graph for the Soviet stockpile concave up or concave down? What does this mean?
Fantastic news! We've Found the answer you've been seeking!
Step by Step Answer:
a The US total inventory was at a relative maximum in 1965 197...View the full answer

Answered By
Mehwish Aziz
What I have learnt in my 8 years experience of tutoring is that you really need to have a friendly relationship with your students so they can come to you with their queries without any hesitation. I am quite hardworking and I have strong work ethics. Since I had never been one of those who always top in the class and always get A* no matter what, I can understand the fear of failure and can relate with my students at so many levels. I had always been one of those who had to work really hard to get decent grades. I am forever grateful to some of the amazing teachers that I have had who made learning one, and owing to whom I was able to get some extraordinary grades and get into one of the most prestigious universities of the country. Inspired by those same teachers, I am to be like one of them - who never gives up on her students and always believe in them!
3+ Reviews
10+ Question Solved
Related Book For 

Question Posted:
