

The number of reported cases of AIDS in the United States by year of reporting at 4-year
Question:
The number of reported cases of AIDS in the United States by year of reporting at 4-year intervals since 1980 is given in this table:
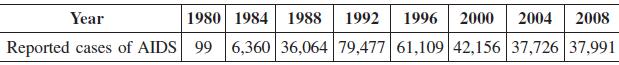
a. Plot these data on a graph with time t (years after 1980) on the x axis.
b. Find the equation of the least-squares line for the given data.
c. How many cases of AIDS does the least-squares line in part (b) predict will be reported in 2012?
Fantastic news! We've Found the answer you've been seeking!
Step by Step Answer:
a b So the equation of the least squares line is y 12...View the full answer

Answered By
Vijesh J
My passion to become a tutor is a lifetime milestone. Being a finance and marketing professional with hands-on experience in wealth management, portfolio management, team handling and actively contributing in promoting the company. Highly talented in managing and educating students in most attractive ways were students get involved. I will always give perfection to my works. Time is the most important for the works and I provide every answer on time without a delay. I will proofread each and every work and will deliver a with more perfection.
5+ Reviews
15+ Question Solved
Related Book For 

Calculus For Business, Economics And The Social And Life Sciences
ISBN: 9780073532387
11th Brief Edition
Authors: Laurence Hoffmann, Gerald Bradley, David Sobecki, Michael Price
Question Posted:
