

Question: The table below gives the total world wind energy capacity (in megawatts) in recent years. (a) Let t be the number of years since 2000,
The table below gives the total world wind energy capacity (in megawatts) in recent years.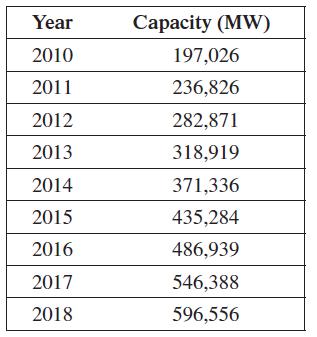
(a) Let t be the number of years since 2000, and C the capacity (in MW). Find functions of the form C = mt + b, C = at2 + b, and C = abt that fit the data at 2010 and 2018.
(b) Use a graphing calculator to plot the data in the table and to graph the three functions found in part (a). Which function best fits the data?
(c) If you have a graphing calculator or computer program with a quadratic and an exponential regression feature, use it to find a quadratic function and an exponential function that approximately fit the data in the table. How do these answers compare with the answers to part (a)?
(d) Using the three functions from part (a) and the functions from part (c), predict the total world wind capacity in 2019.
Year 2010 2011 2012 2013 2014 2015 2016 2017 2018 Capacity (MW) 197,026 236,826 282,871 318,919 371,336 435,284 486,939 546,388 596,556
Step by Step Solution
3.42 Rating (158 Votes )
There are 3 Steps involved in it
a b The quadratic is the best fit c The functions are C 140275t 2 1157811 6059... View full answer

Get step-by-step solutions from verified subject matter experts