

Question: The table below gives U.S. coal consumption for selected years. (a) Draw a scatterplot, letting t = 0 represent 1950. (b) Use the quadratic regression
The table below gives U.S. coal consumption for selected years.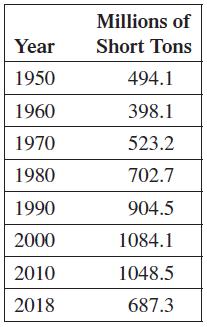
(a) Draw a scatterplot, letting t = 0 represent 1950.
(b) Use the quadratic regression feature of a graphing calculator to get a quadratic function that approximates the data.
(c) Graph the function from part (b) on the same window as the scatterplot.
(d) Use cubic regression to get a cubic function that approximates the data.
(e) Graph the cubic from part (d) on the same window as the scatterplot.
Year 1950 1960 1970 1980 1990 2000 2010 2018 Millions of Short Tons 494.1 398.1 523.2 702.7 904.5 1084.1 1048.5 687.3
Step by Step Solution
3.52 Rating (162 Votes )
There are 3 Steps involved in it
a b y 01743t2 199... View full answer

Get step-by-step solutions from verified subject matter experts