

The following table gives the amount of coal (in thousand short tons) consumed by U. S. utilities
Question:
The following table gives the amount of coal (in thousand short tons) consumed by U. S. utilities to produce electricity.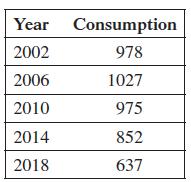 (a) Plot the data by letting t be the years since 2000. Would a linear or quadratic function model these data best?
(b) Find the quadratic function defined by ƒ (t) = a(t - h)2 + k that models the data. Use the highest point as the vertex, (h, k). Then choose (18, 637) as a second point to determine a.
(c) Use the quadratic regression feature on a graphing calculator to find the quadratic function that best fits the data. Graph this function on the same calculator window as the data.
(d) Graph the function from part (b) on the same calculator window as the data and function from part (c). Do the graphs of the two functions differ by much?
(e) Use the functions from parts (b) and (c) to predict the amount of coal consumed by U.S. utilities to produce electricity in 2025.
Step by Step Answer:
a b The vertex is at 61027 so f has the form a t 6 2 1027 usi...View the full answer


