

The three distancetime graphs below show the motion of a car over time. Assuming the three graphs
Question:
The three distance–time graphs below show the motion of a car over time.
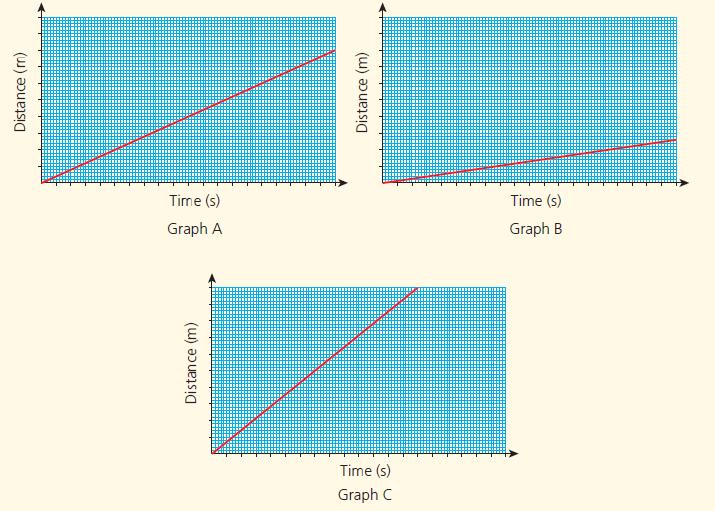
Assuming the three graphs are drawn to the same scale, which one shows the car travelling the slowest? Justify your answer.
Fantastic news! We've Found the answer you've been seeking!
Step by Step Answer:
Let the relation between ...View the full answer

Answered By
Anik Kumar Bosu
I am expert in Maths, Physics, Chemistry and Biology. I also teach student from 3 years. Students becomes satisfied by my teaching. So, do not worry.
0 Reviews
10+ Question Solved
Related Book For 

Cambridge Checkpoint Lower Secondary Mathematics Student's Book 7
ISBN: 9781398301948
3rd Edition
Authors: Frankie Pimentel, Ric Pimentel, Terry Wall
Question Posted:
