

Fifty 10-gram samples of a particular type of mushroom are collected by volunteers at a university and
Question:
Fifty 10-gram samples of a particular type of mushroom are collected by volunteers at a university and tested. The following table shows the mass of toxins, in hundredths of a gram, in these samples.
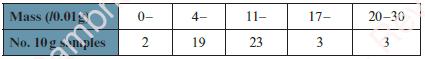
a. Draw a cumulative frequency curve to illustrate the data.
b. Use your curve to estimate, correct to 2 decimal places:
i. The interquartile range
ii. The range of the middle 80%.
c. It was found that toxins made up between 0.75% and 2.25% of the mass of n of these samples. Use your curve to estimate the value of n.
d. Make an assessment of the variation in the percentage of toxic material in these samples. Can you suggest any possible reasons for such variation?
Fantastic news! We've Found the answer you've been seeking!
Step by Step Answer:
a To draw a cumulative frequency curve we first need to calculate the cumulative frequencies The cum...View the full answer

Answered By
User l_960928
I completed my degree in 2017. I am working as an Accountant.But I can manage all the subjects and I am expert in that.I did tuitions to some of the childrens up to plustwo.So I have the experience.
0 Reviews
10+ Question Solved
Related Book For 

Cambridge International AS & A Level Mathematics Probability & Statistics 1 Coursebook
ISBN: 9781108407304
1st Edition
Authors: Dean Chalmers, Julian Gilbey
Question Posted:
