

The areas, in cm 2 , of some circuit boards are represented in the following graph. a.
Question:
The areas, in cm2, of some circuit boards are represented in the following graph.
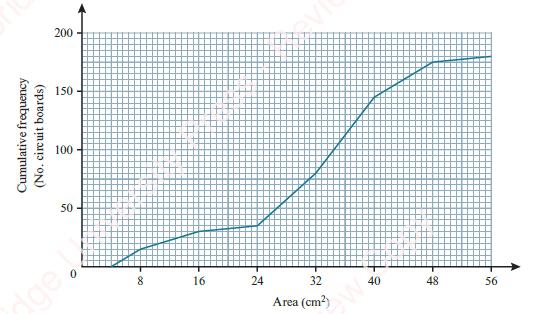
a. State the greatest possible range of the data.
b. Construct a box-and-whisker diagram to illustrate the data.
c. Find the range of the middle 60% of the areas.
d. An outlier is an extreme value that is more than 1.5 times the interquartile range above the upper quartile or more than 1.5 times the interquartile range below the lower quartile. Find the areas that define the outliers in this set of data, and estimate how many there are. How accurate is your answer?
Fantastic news! We've Found the answer you've been seeking!
Step by Step Answer:
solution given graph ...View the full answer

Answered By
Gurjot Dua
1 love teaching with science and math. I have 10 years experience to dedicate my job with fully potential
0 Reviews
10+ Question Solved
Related Book For 

Cambridge International AS & A Level Mathematics Probability & Statistics 1 Coursebook
ISBN: 9781108407304
1st Edition
Authors: Dean Chalmers, Julian Gilbey
Question Posted:
